PRODUCTS • INFRASTRUCTURE OBSERVABILITY

Infrastructure Observability for the Modern Enterprise

Unified observability for on-premises and cloud infrastructure, physical and virtual machines, applications, and containers. Surface insights from across the IT environment, accelerate troubleshooting and reduce MTTR.

Comprehensive visibility across the stack
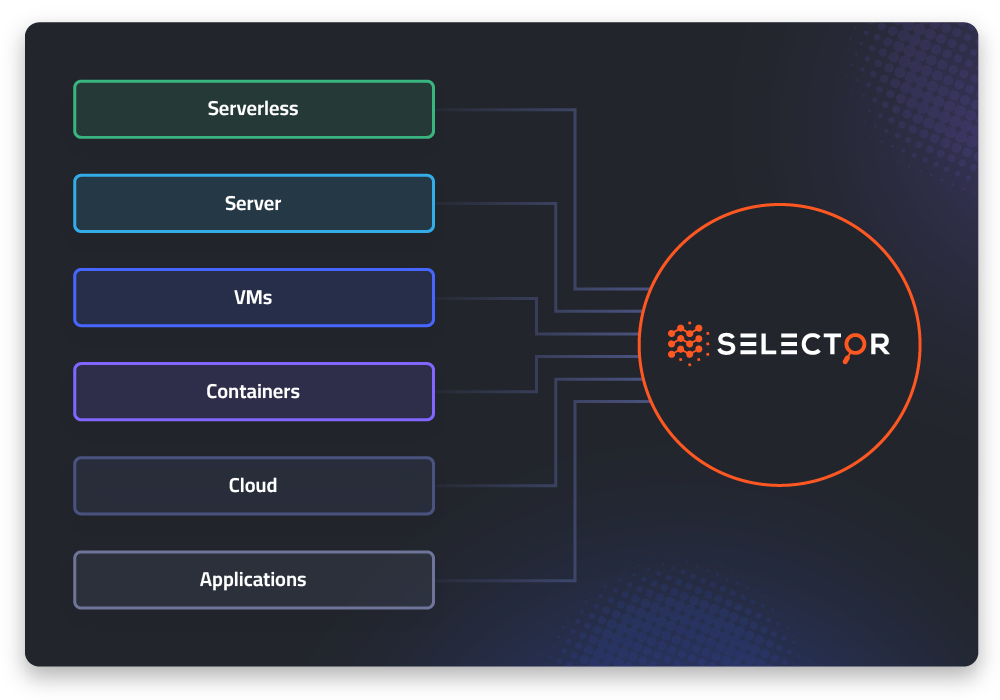
Collect, analyze, visualize, and alert on telemetry from commercial, community, or proprietary systems and software
Gain valuable insight into service performance through KPIs like availability, response time, error rates, and throughput
Visualize the status of your infrastructure and applications and facilitate your investigation with interactive dashboards

Proactively detect issues and coordinate with peers in real-time
Build interactive dashboards to visualize the status of your infrastructure and applications to facilitate your investigation
Detect and triage resourcing problems, unexpected latency, errors, and performance issues
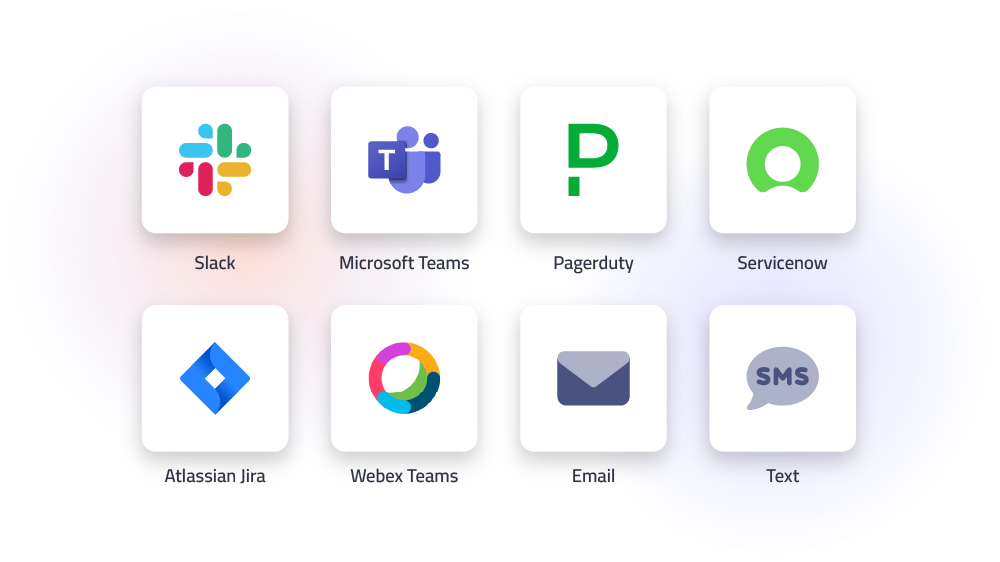
Easily manage alerts and notifications with Pager Duty, Opsgenie, as well as Slack, Teams, email, webhooks, and more

Gain deeper insights with natural language and advanced analytics
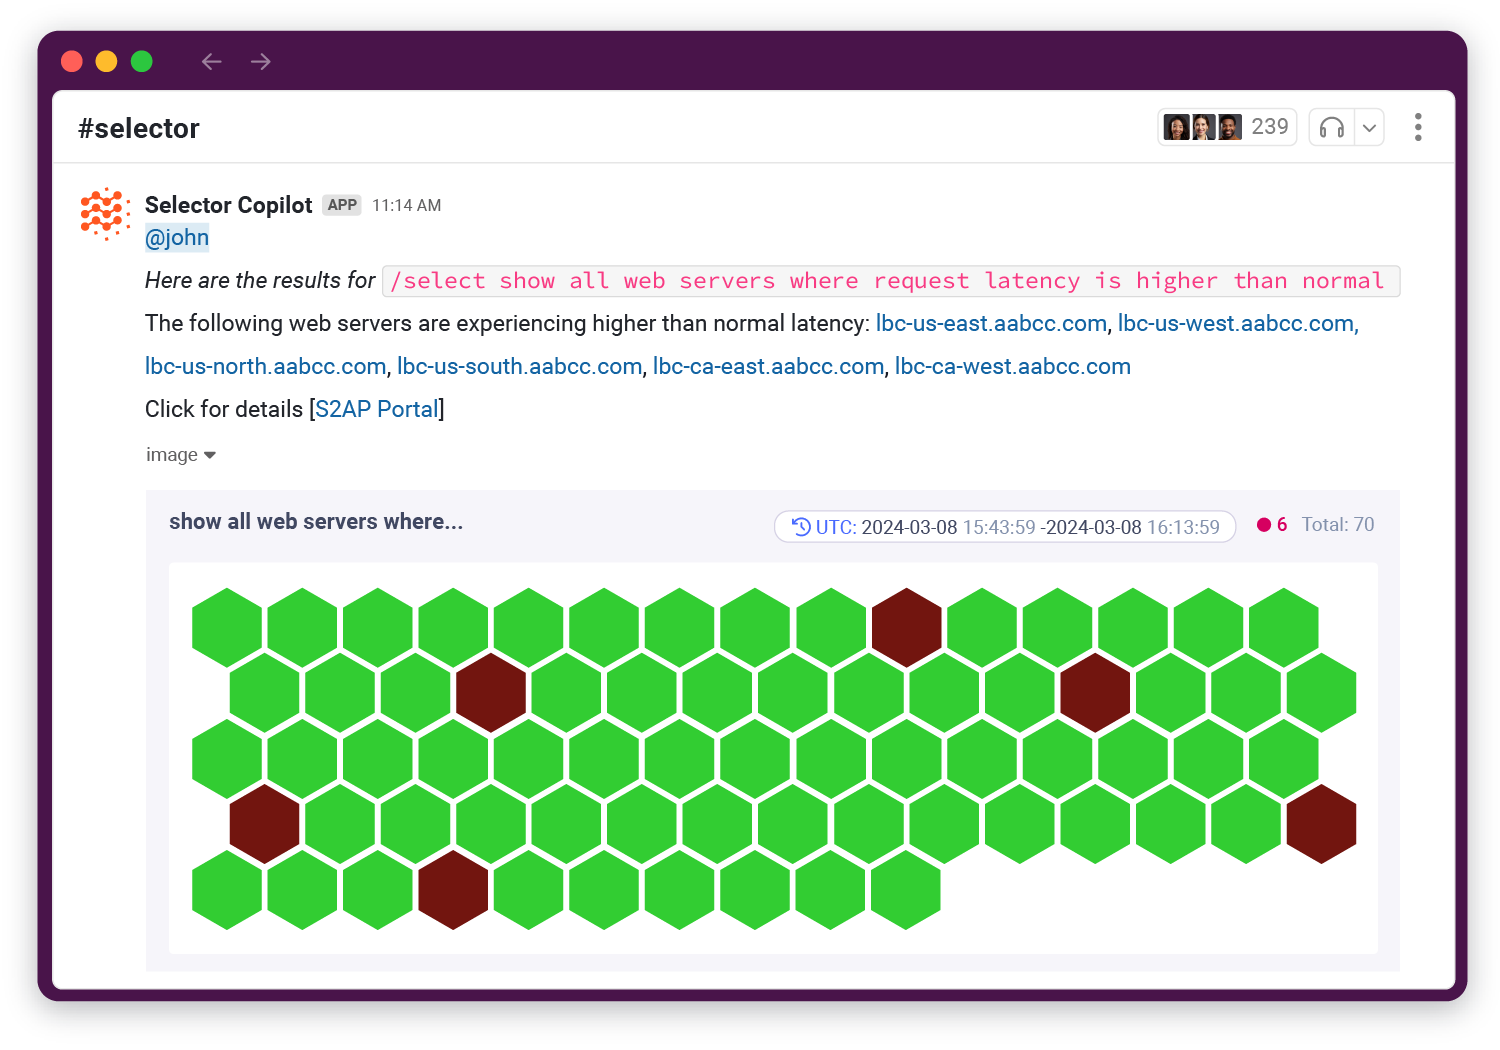
Unlock insights with natural language querying; there is no need to learn a new query language
Aggregate telemetry to get a comprehensive view across your infrastructure using built-in aggregation functions
Leverage automated log metrics to identify anomalies and investigate unusual log generation patterns
Drill down into metric data using tags and labels to uncover detailed insights

Before Selector, we lacked the end-to-end visibility needed to see what was happening across our applications, infrastructure, and network. Now we have a consolidated view of all critical data sources allowing us to proactively detect and resolve issues faster to keep our services running and our customers happy.

David Iannone
VP of IT Operations, TracFone

Explore the Selector platform