What Powers the Selector Platform
Selector is built for scale, speed, and clarity. The platform is made up of four functional services – each responsible for transforming raw telemetry into real-time, actionable insights. As you scroll, see how each layer contributes to the full picture.
1
Collection Service
Ingest everything, everywhere, all at once
Collection Service
Ingest everything, everywhere, all at once:
- Connects to 300+ telemetry sources – logs, metrics, configs, flow records, SNMP, gNMI, REST, and more
- Pulls from existing systems (like Splunk, NetBox, ThousandEyes) and direct device streams
- Caches and enriches data at the edge for real-time responsiveness
- Supports synthetic agents and passive monitoring with no agents required
2
Data Hypervisor
Normalize and enrich for cross-domain context
Data Hypervisor
Normalize and enrich for cross-domain context:
- Extensible Data Compiler parses and understands schemas from any data source
- Cleans, labels, and transforms operational data – incoming telemetry, configurations, logs, flow, and metadata
- Transforms raw data and prepares it for Al models
3
Knowledge Service
Correlate across layers. Detect what matters.
Knowledge Service
Correlate across layers. Detect what matters:
- Applies clustering, classification, and enrichment to make unstructured data usable
- Ties together logs, metrics, and events into unified operational views
- Feeds enriched data to downstream services for correlation and RCA
- Hosts Selector’s continuously updated Knowledge Graph
- Runs ML-based correlation, anomaly detection, and pattern mining
- Identifies relationships between symptoms and root causes across apps, infra, and network
- Powers alerting, recommendations, and the query engine for RCA
4
Collaboration Service
Deliver insight where your teams work
Collaboration Service
Deliver insight where your teams work:
- Routes insights and RCA into Slack, Teams, and ITSM workflows
- Hosts Selector Copilot – powered by the industry’s first Network Language Model (NLM)
- Supports natural language queries, incident summaries, and interactive investigations
- Delivers context and clarity directly into daily workflows
AI That Understands Your Network
Selector isn’t just collecting and visualizing data – it’s continuously learning from it. Our AI/ML engine is purpose-built for operations, combining unsupervised learning with supervised models for prediction and classification. Together, they power correlation, enrichment, summarization, and foresight across your stack.

1
MLMESH™: The ML Foundation
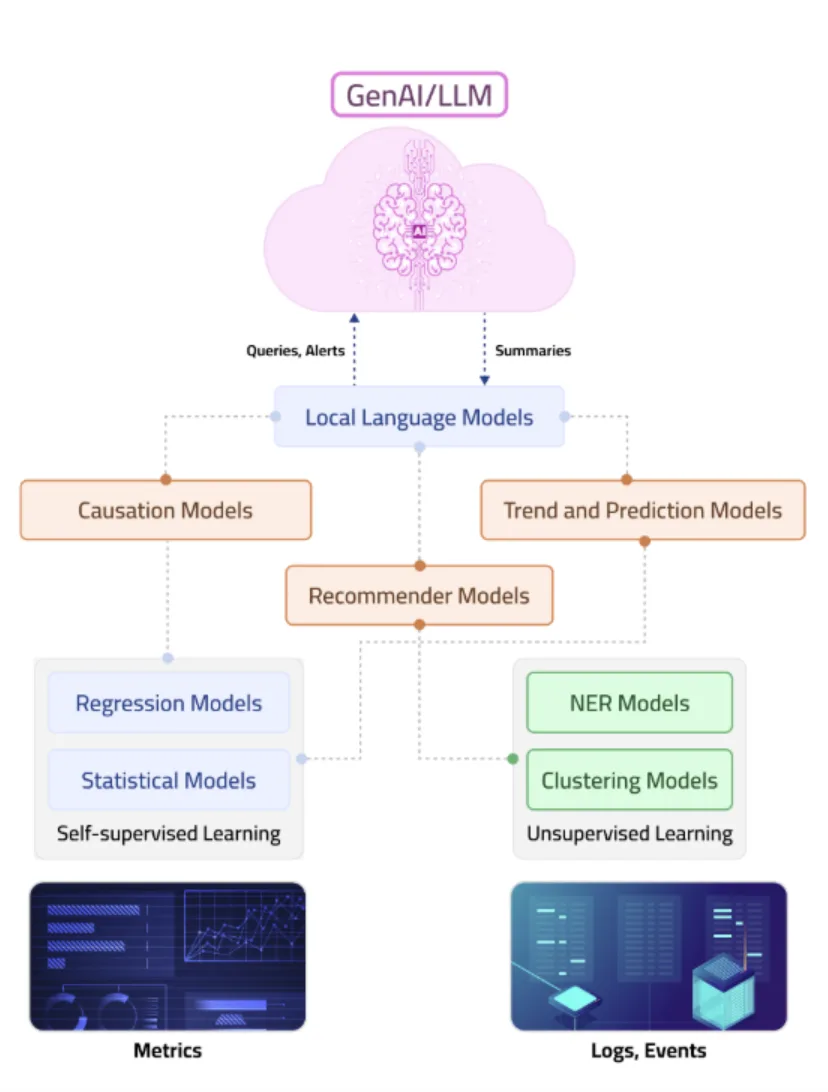
MLMESH™ leverages both unsupervised learning (for anomaly detection, clustering, and pattern mining) and supervised models (for predictive tasks and clarification) – all running in real time without retraining delays.
Selector’s patented layer for streaming ML. It enables:
- Real-time anomaly detection
- Entity extraction and pattern mining from logs
- Root Cause Analysis
- Forecasting
2
Network Language Model (NLM)
Selector’s proprietary LLM is the first of its kind – trained not on public web data, but on operational telemetry from real-world networks and infrastructure.
Selector’s proprietary LLM is the first of its kind – trained not on public web data, but on operational telemetry from real-world networks and infrastructure:
- Copilot’s plain-language queries and RCA summaries
- Alert descriptions and response recommendations
- Natural language search and topology understanding
3
Predictive Intelligence
Selector supports forecasting and anomaly prediction at multiple levels
Selector supports forecasting and anomaly prediction at multiple levels:
- Time series trend prediction (capacity, usage, latency)
- Event frequency and entity-level forecast
- Sequential pattern mining for precursors and cascading failure risks
Correlation & Root Cause Analysis
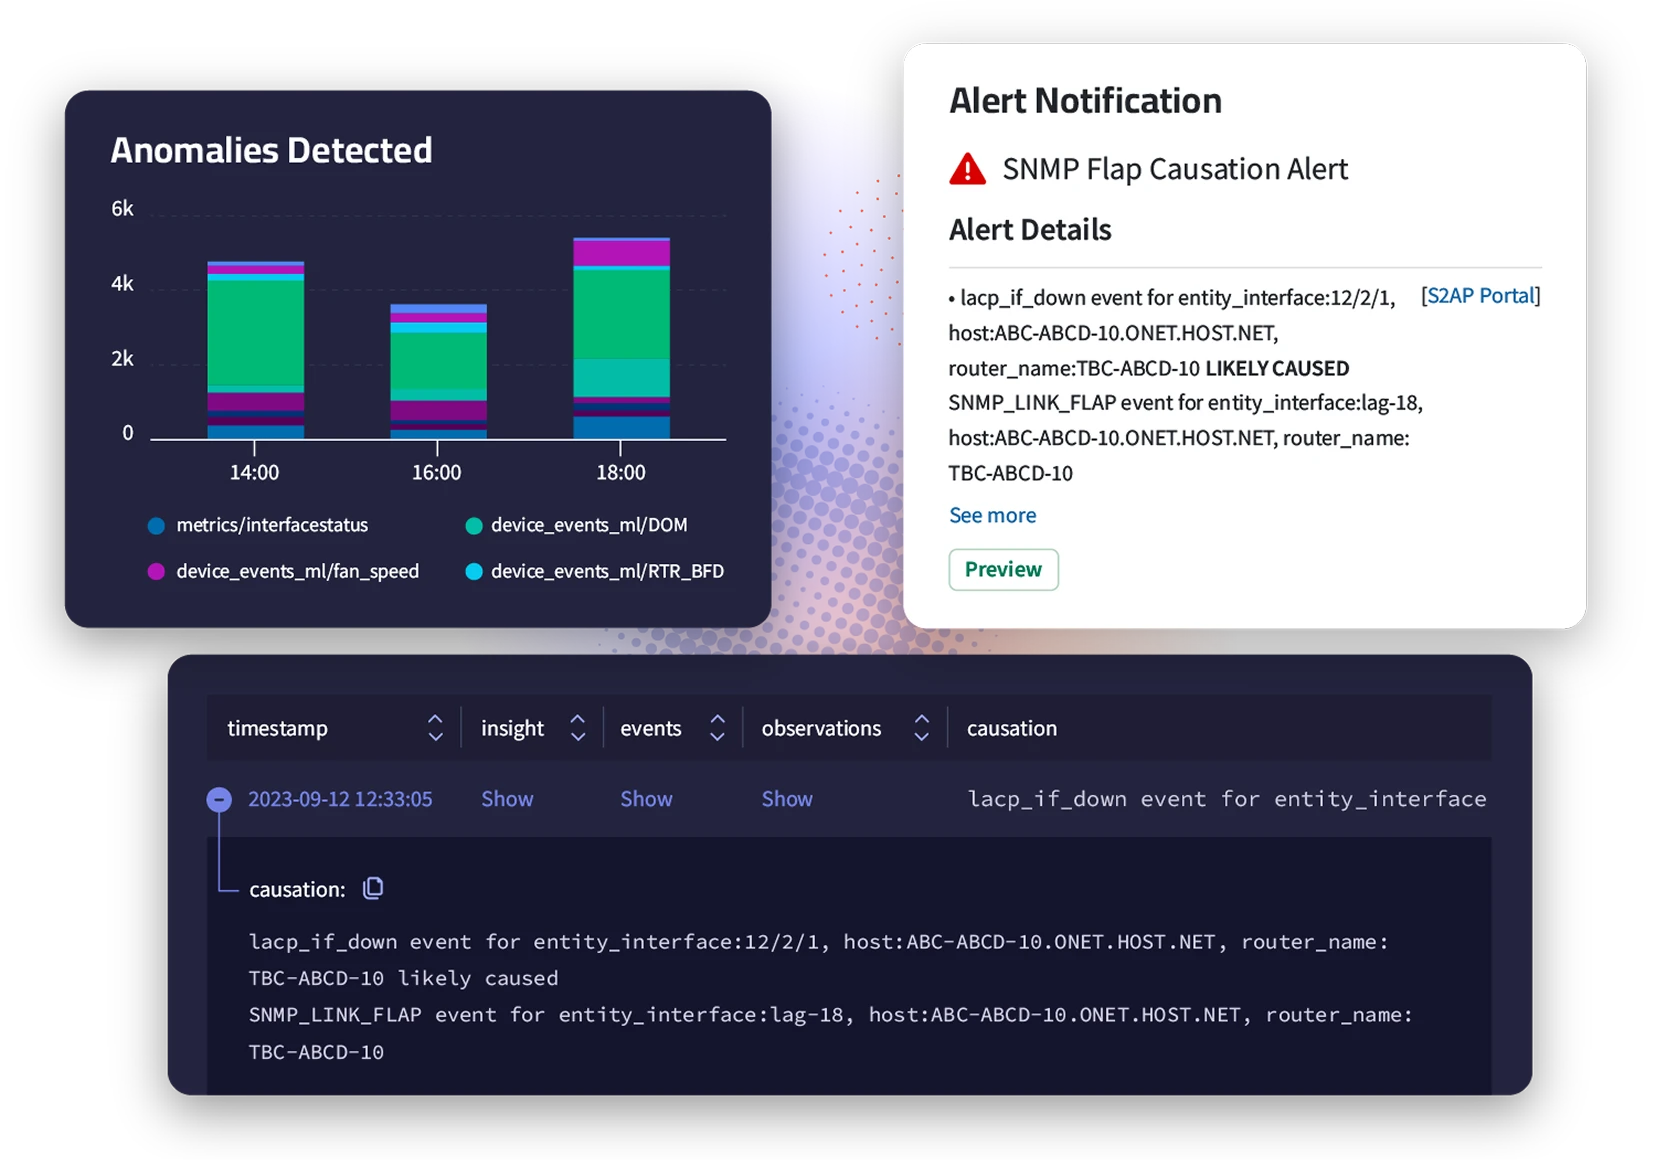
Go from alert to answer – instantly. Selector connects events, metrics, and logs across every layer of your stack to surface the true root cause with explainable insights.
- Suppress secondary alerts and highlight primary failures
- Link application and infrastructure issues to upstream impact
- Output RCA directly into Slack, Teams, or ITSM tools
- Reduce alert fatigue and accelerate MTTR

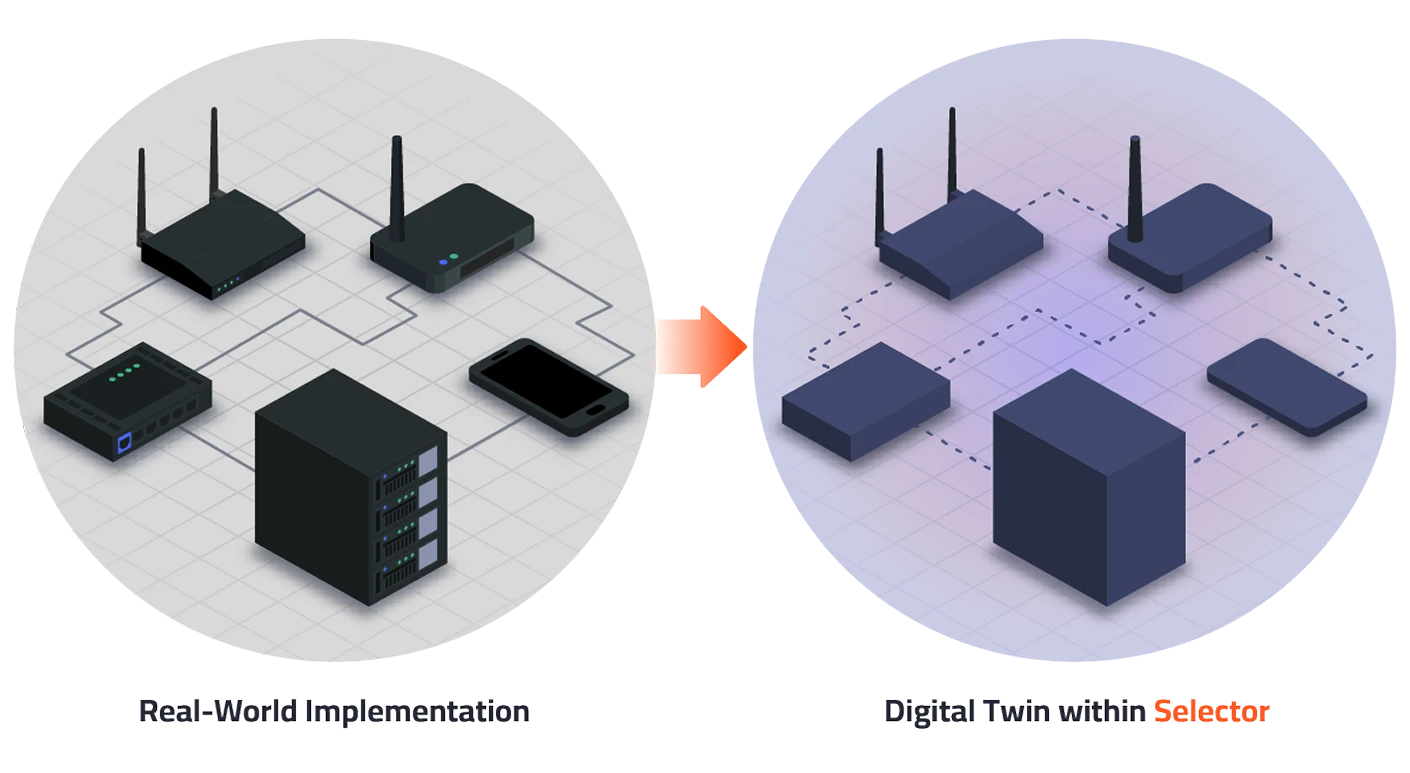
Model your environment in real time.
Selector continuously maps your environment to show live dependencies, simulate risk, and visualize service health at every layer.
- Explore live topology maps across physical, virtual, and cloud
- Simulate outages, configuration changes, or failovers
- Plan capacity and understand upstream/downstream impact
- Enable RCA through service-layer modeling

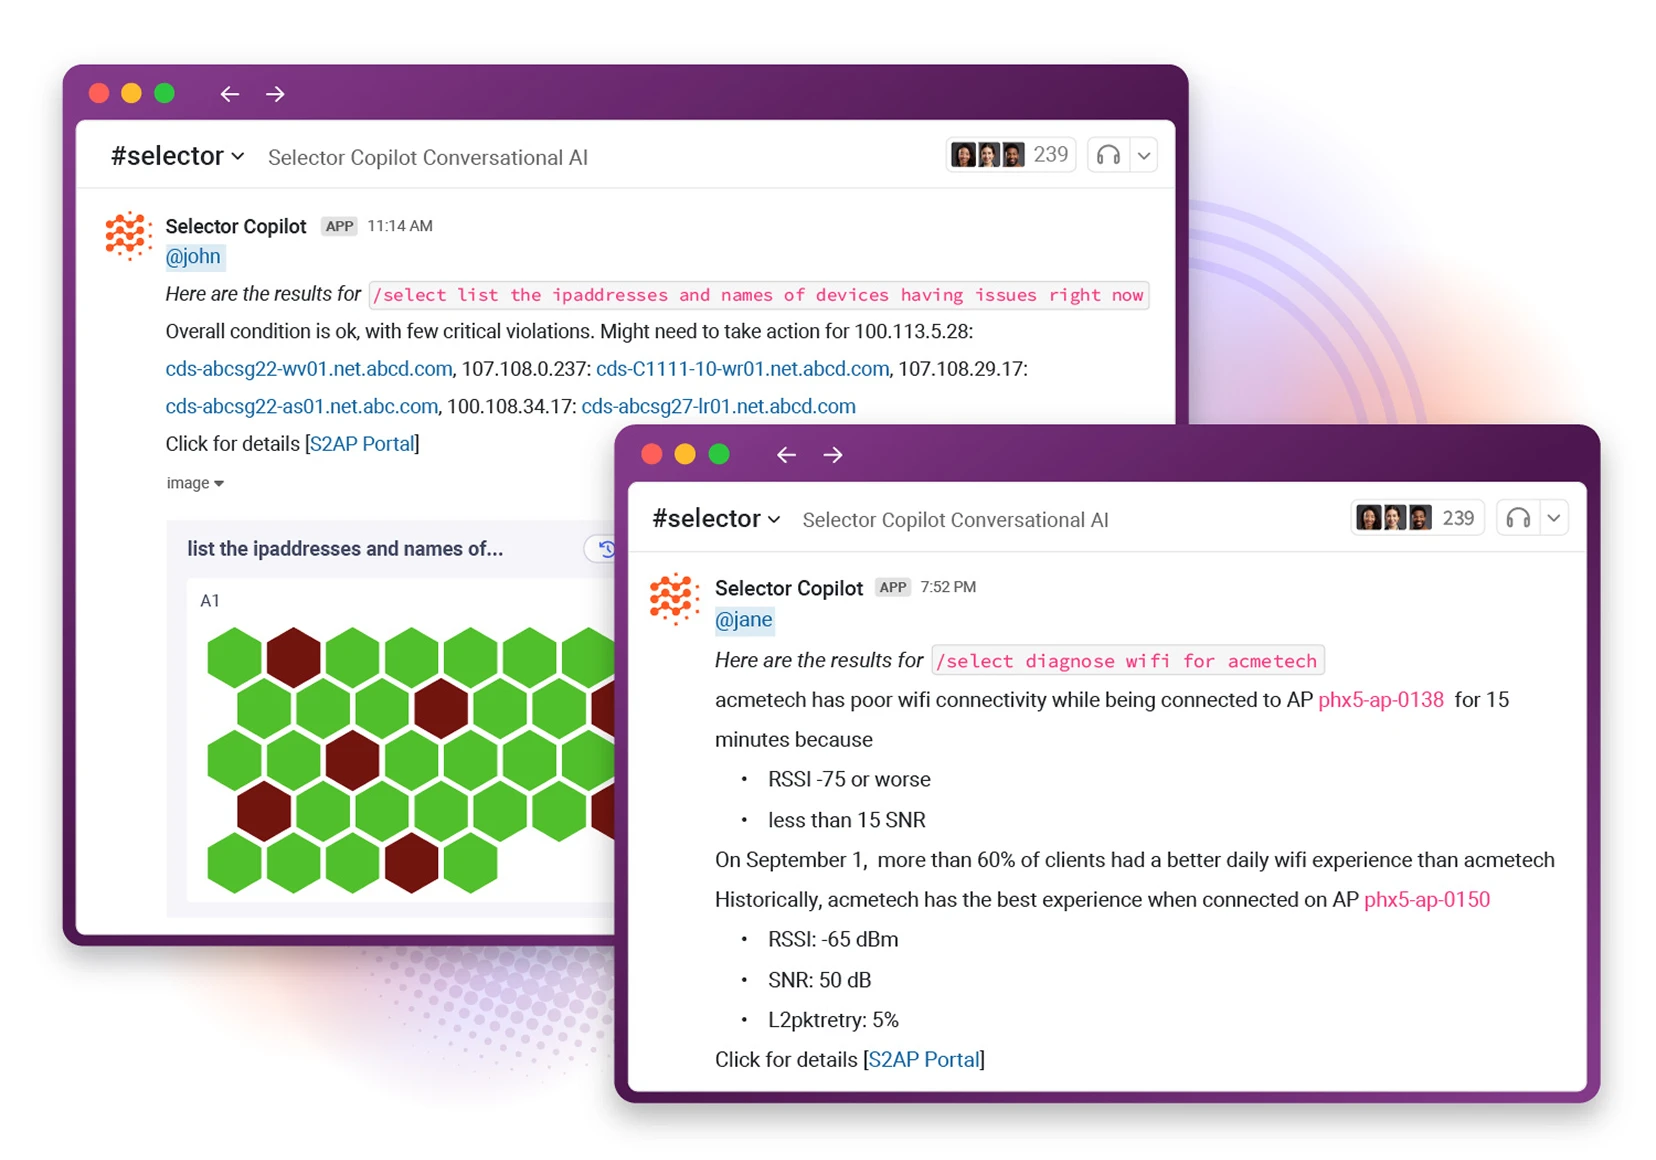
Ask questions. Get answers. Take action.
Selector Copilot uses our domain-specific Network Language Model (NLM) to turn natural language queries into structured, actionable insights.
- Investigate RCA, history, and topology in plain English
- Get impact summaries and remediation steps in chat
- Accessible via Slack, Teams, CLI, or UI
- Backed by Selector’s operational Knowledge Graph


Try our AI for free
Forget Wireshark. Now you can chat with your packets with Selector Packet Copilot.


