Quality medical care today relies on “health systems” built from geographically distributed healthcare settings such as hospitals, urgent care clinics, imaging centers, nursing homes, pharmacies, and specialist offices, among many others. Each setting shares data within the broader health system through Electronic Medical Records (EMRs). EMR systems, which were purpose-built to manage patient records, help improve patient outcomes through the real-time sharing of patient data. Several EMR systems are available today, with Epic being the most prominent.
Over time, EMRs have evolved into a broader healthcare operating system, helping administrators manage health records, nurse work assignments, nurse reviews, employee assessments, payroll, budgeting, recruiting, patient portals, patient records, and more. Because EMRs are so deeply ingrained into the hospital’s business, even the slightest performance issue materially affects the entire organization.
Unfortunately, performance issues occur frequently, and the impact on the organization is often severe. This is because the EMR system is part of a complex healthcare IT ecosystem, where an issue in one place, such as the network, can wreak havoc across all the systems within the environment. Given these risks, organizations must ensure the proper health of the IT environment across their stack—from network, compute, and storage infrastructure to cloud and EMR applications.
Historically, administrators relied on a suite of products to help address these challenges. IT teams would manually inspect the data and connect the dots to resolve problematic issues. As one might imagine, this process is time-consuming and requires significant effort on behalf of the team. Fortunately, Selector’s purpose-built solution for healthcare observability delivers comprehensive full-stack observability and powerful AI/ML-driven capabilities, such as root cause analysis and event correlation, that continuously analyze the environment, surfacing insights in real-time.
The Challenges of Monitoring Healthcare IT
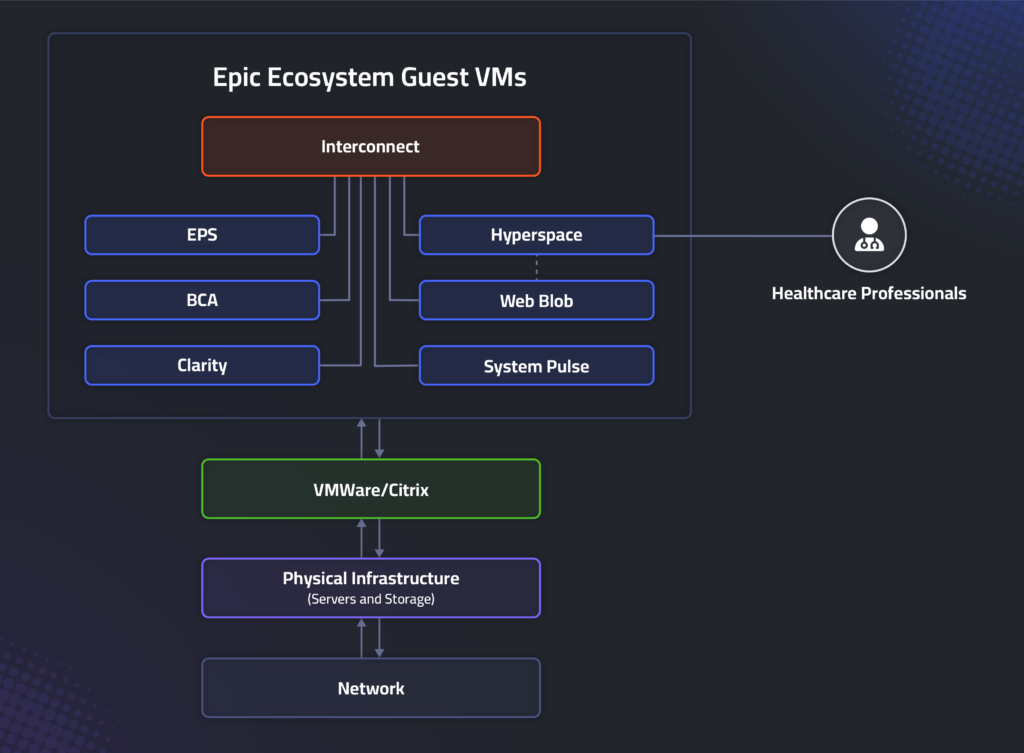
The historical challenges of performance monitoring and troubleshooting EMRs are mainly due to the complexity of the ecosystem they are within. This ecosystem includes network, compute/SAN, virtualization/VSAN, and applications and is often composed of hundreds to thousands of servers, switches, routers, firewalls, access points, tablets, mobile desktops, and more.
Complex Ecosystem
Network
All services sit on top of the network, which can often involve thousands of different types of devices. Because network performance issues inevitably affect the services sitting on top of it, understanding network health is essential. However, this is challenging due to the complexity of modern networks and challenges such as Wi-Fi congestion, routing and switching issues, firewall misconfigurations, and transient capacity constraints, to name a few. These conditions all translate to difficult-to-troubleshoot problems across the IT environment.
Compute/SAN
On top of the network is the physical infrastructure, including CPU, memory, and disk, all connected via the network. Also, at this layer are the various storage solutions employed by the health system to support the long-term storage of medical records and patient imaging.
Virtualization
The VMware ecosystem is built on top of compute and storage infrastructure and consists of the ESXi, vSphere, and VSAN services. Monitoring VMware’s health is essential because if the VMWare hosts are not working correctly, the guest virtual machines are unlikely to operate as expected.
Applications
Many different applications support the hospital and are typically hosted within VMware. These include the various services that comprise Epic, including BCA (prescriptions), EPS (printing services), and BLOB, the binary object store that manages the different aspects of collecting and retrieving the data.
Limitations of Current Solutions
Given the complexity of healthcare IT ecosystems, issues can easily go unnoticed. Consider this scenario: Hard drives degrade within the SAN servicing the block store service—Epic’s BLOB service, a critical component of the Epic ecosystem. Aggregate seek times, throughput, and general performance of the SAN begin to decline. Over time, users start to complain. Everything works, but things seem slower. Nurses, doctors, and administrators are all experiencing the issue.
Epic’s integrated monitoring—SystemPulse—shows the application is working as expected, but the reports continue. At this point, the team will start guessing what the problem is. Meanwhile, the performance degradation has begun to materially affect the organization.
Quickly resolving issues like these requires an observability solution that provides comprehensive visibility across the entire ecosystem, from the network through the applications. This solution also needs to collect and correlate telemetry across every single one of these domains. Further, due to the sensitivity of healthcare data, a solution must be able to securely collect data from on-premises environments.
Unfortunately, many existing solutions do not meet all these needs. Products like SolarWinds, for instance, do not have all the data (they have no way of collecting EPIC data, for example) and cannot bridge the data between different domains, so capabilities such as automated correlation and root cause analysis are not possible. Without a solution to address the challenges of this environment, identifying and resolving problems continues to be time-consuming, creating headaches for all healthcare staff trying to leverage essential systems like Epic on a routine basis.
Selector: Observability and AIOps for the Epic EMR Environment
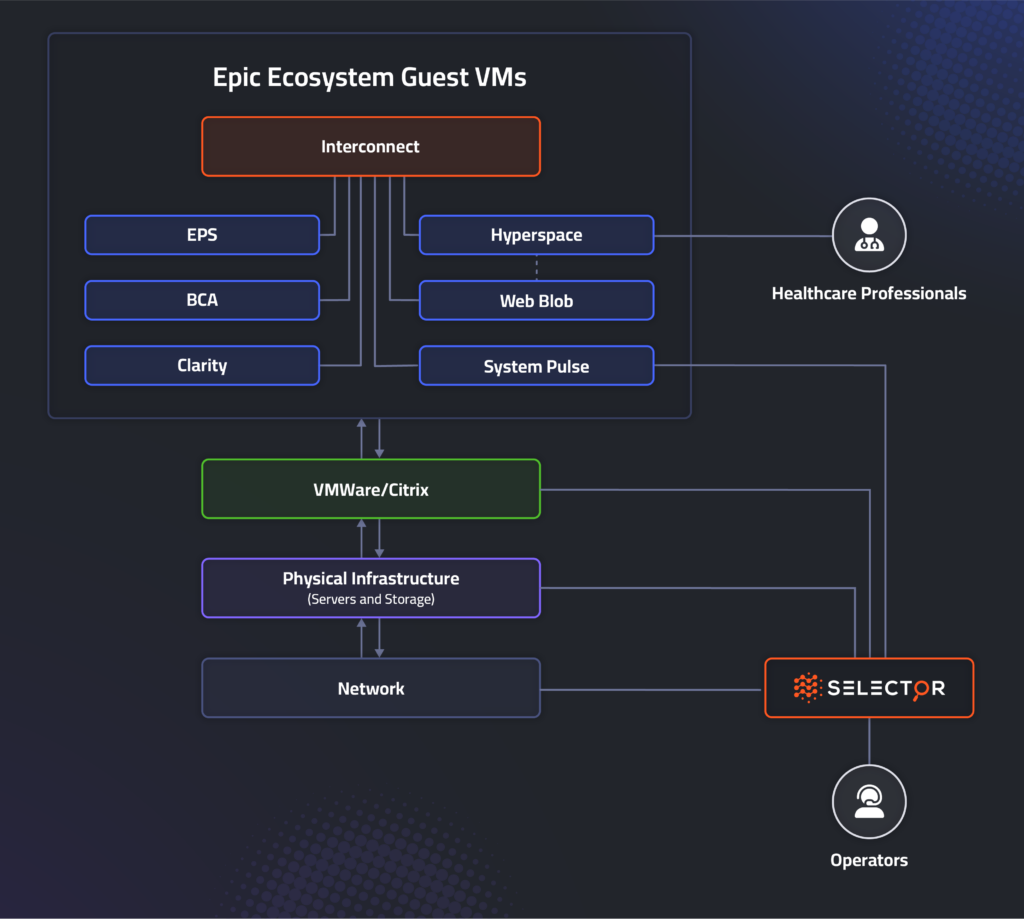
To help hospital operators proactively optimize performance and identify issues before they cause problems, Selector provides a purpose-built technology for end-to-end observability of the healthcare IT environment, which can be deployed on-premises or in the cloud.
Comprehensive Visibility Enables True Full-Stack Observability
Selector provides comprehensive observability by collecting and analyzing real-time performance telemetry from the network to applications and everything in between. It collects the metrics, logs, and events as well as all the metadata from every layer within the healthcare IT ecosystem—network, compute, storage, cloud, virtualization, applications—and warehouses the data in the Selector data lake.
As a result, Selector enables true full-stack observability, accounting for the network layer when most other vendors have ignored this critical component.
Auto-baselining Immediately Surfaces Abnormalities
Selector applies machine learning to all metrics and logs from its ingest layer, surfacing anomalies. It baselines telemetry in real-time and immediately identifies when a system’s performance deviates from its normal behavior, including accounting for cyclicity—what’s expected during certain times of day—and seasonality—what’s typical for certain times of the year.
These baselines are then used to power dynamic alerting rules, sparing IT teams from the manual activities often spent maintaining these rules throughout the year. Turnkey visualizations further illustrate the system’s behavior, helping operators quickly find issues and enabling them to move from reactive to proactive workflows.
Normalizing Epic’s System Pulse Data Creates Actionable Telemetry to Support SRE Initiatives
Selector integrates with System Pulse and interprets its underlying telemetry so that operators can perform “apples-to-apples” data comparisons. For example, Selector identifies what’s typical for the environment and flags any detected anomalies, such as a deployment with ten errors in the last second, which usually has zero. Insights like these enable operations teams to improve reliability while applying SRE principles such as SLOs, SLIs, and error budgets.
Automated Correlation Fast-Tracks Issue Remediation
To make data more meaningful for analysis and correlation, Selector reduces all metrics and logs to the lowest common denominator: events. The resulting event data is enriched with timestamps and metadata from inventory systems, CMDB, and other sources. This metadata provides essential context, such as IP address, host, and site location.
Selector’s recommender models leverage temporal and contextual correlation to link anomalies and events that otherwise seem unrelated. Correlation graphs illustrate the events that were temporally or contextually related to the reported incident. At the same time, association models identify the precipitating event that led to a given incident, pointing operators toward the root cause.
Conclusion: Better Observability = Improved Patient Care
By employing a solution like Selector to minimize downtime and prevent full-blown outages, healthcare settings can provide better patient care, improve patient satisfaction, optimize employee productivity, and reduce overall IT costs. It’s not uncommon for today’s patients to feel overwhelmed as they navigate their care with different providers across multiple offices. Healthcare systems that can improve patient confidence are therefore in a position to stand out amongst their competitors.