Understanding the state of your network and infrastructure is a critical responsibility for operations teams. Without their ever-watchful eye, network issues can cause problems ranging from annoying performance issues to downtime. To detect, prevent, and address these issues, operations teams have relied on a combination of monitoring and manual correlation, leveraging whatever tools were available.
This approach has proven to be time-consuming for staff, prone to human error, and can lead to cascading issues when problems are misdiagnosed. Moreover, the complexity and volume of data generated by the environment continue to grow, straining resource-strapped Ops teams.
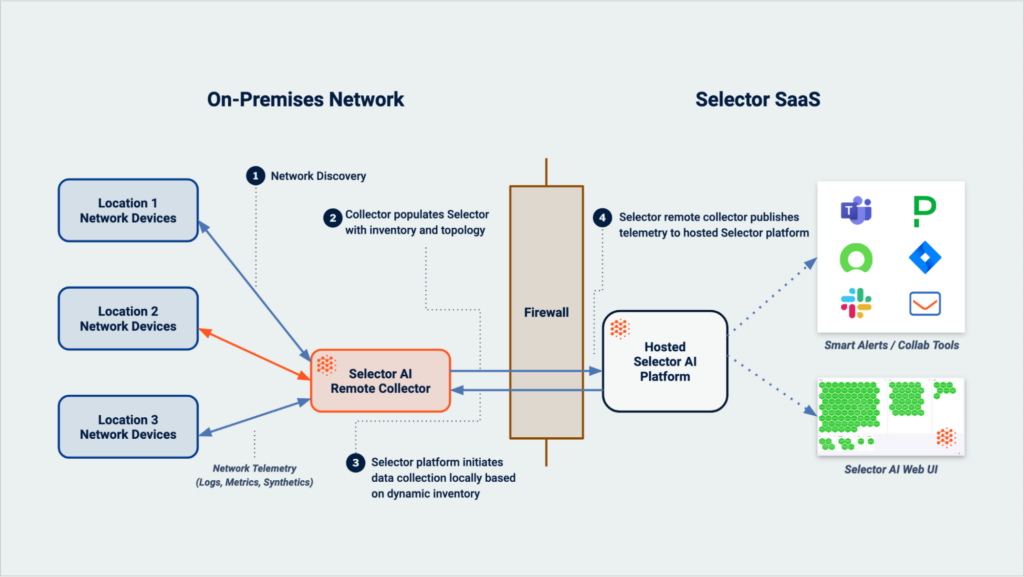
Fortunately, a combination of observability and AIOps introduced by Selector offers a new approach to address these challenges. Selector auto-discovers devices, metadata, and relative topology—and stores the data within a hosted Configuration Management Database (CMDB). The collected metadata informs per device profiles driving telemetry collection. The telemetry is then continuously analyzed by AI/ML, correlating anomalies and identifying root causes. The overall solution accelerates troubleshooting, enabling operators to focus on remediation.
Discovering Devices and Collecting Topology
A key advantage of Selector’s solution is its ability to automatically collect and leverage the inventory and topology of the network.
Selector offers an agent to discover and map your network infrastructure. The process works similarly to how a network engineer might accomplish the task: using credentials (kept securely, on-site) to incrementally log into the various network devices in your environment and collect the related topology data.
Once connected to a device, Selector fingerprints the vendor, model, and version. Network topology data such as ARP, STP, CDP, LLDP, routing protocol sessions, and other data are then used to decide where to go next to repeat the process.
Syncing Network Topology
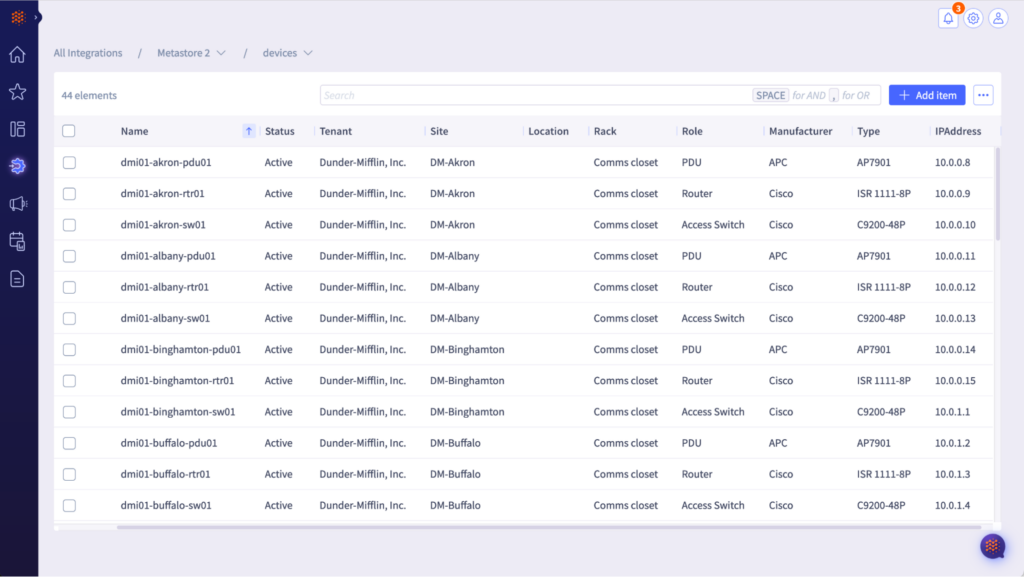
Topology data and related metadata are synced internally to Selector’s internal CMDB.
CMDBs were historically little more than a basic file containing details of an organization’s IT environment—names of network entities, IP addresses, and credentials.
However, in today’s complex IT environments, CMDBs have become critical tools for IT administrators. Warehousing the complete inventory, topology, and metadata for all discovered devices, Selector’s CMDB subsequently serves as the single source of truth for everything related to your environment.
Customers may use Selector’s CMDB to:
- Manage inventory and related metadata
- Track IP address utilization and assignment history
- Manage secrets
- Many, many other activities
However, Selector’s CMDB has another crucial role: enabling Selector’s AI/ML to connect the dots across your devices.
Telemetry Collection, Processing, and Outcomes
Using a lightweight agent, Selector collects SNMP and streaming telemetry from each discovered device, exercises network connectivity with synthetic traffic and receives syslogs. The agent then securely transmits the associated telemetry to an instance of Selector hosted in the cloud or on your premises.
Selector continuously analyzes this telemetry, applying AI/ML techniques to baseline the received telemetry and identify any anomalies. Next, contextual, temporal, and topological correlation determines the relationship between those anomalies. Associative models then identify the probable root cause of emerging incidents.
The solution is further differentiated through Selector’s AI/ML-driven Smart Alerting.
Smart alerting works through the baselining of telemetry—understanding what is typical for your environment—rather than relying on static, manual thresholds like legacy solutions. This helps ensure that alerting is meaningful rather than an arbitrary preference.
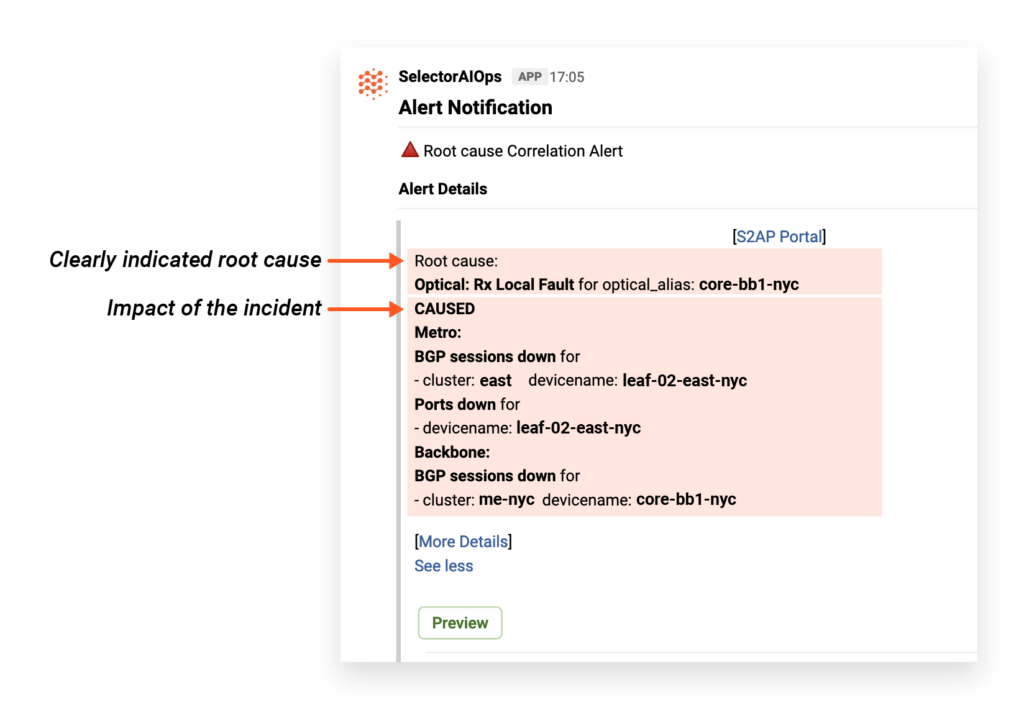
Selector’s correlations automatically consolidate and deduplicate the telemetry data collected by the system, ensuring the team receives discrete, actionable alerts.
Selector’s correlations can also be represented as a JSON object, through which the team can drive various operations activities—for example, ticket creation/maintenance and even closed-loop automation.
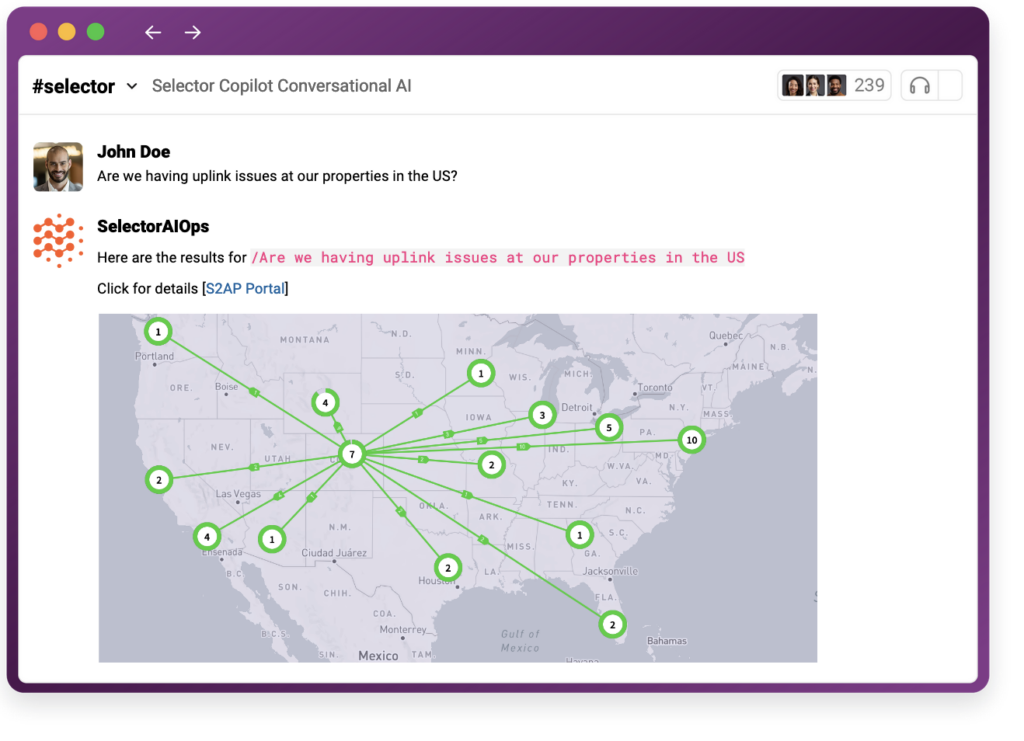
A genAI-based conversational interface further enables operators to explore telemetry using natural language, and dynamic dashboards automatically provide relevant views into telemetry of interest.
Conclusion
Selector’s modern network observability offers a robust solution for operations teams to efficiently detect, prevent, and address network issues. With its automated device discovery, telemetry collection, and smart alerting capabilities, Selector’s solution automates much of the toil involved in setting up an effective observability platform. Further, AIOps moves teams towards proactive management of their networks, helping to reduce downtime and improve overall performance.