Selector CUSTOMER Case StudY
Selector Enhances Visibility and Performance for Leading Web Hosting Company
About The Customer
- One of the largest web and email hosting service providers
- Hosts web pages for millions of small and medium businesses across the globe
- Provides a suite of web, email and security services
Selector Data Inputs
- SNMP metrics and traps
- Syslog
- Firewall session logs
- Config change events
- Link Layer Discovery Protocol (LLDP) for topology discovery
The Challenge
The customer relied on legacy monitoring tools to ensure their network infrastructure was working as expected. With 6,000+ devices from vendors such as A10, Arista, Cisco, Juniper, and Palo Alto, the customer found that tracking the performance of their networking equipment had become increasingly difficult. Their legacy solution, SevOne, pulled over 100,000 metrics per minute from the associated infrastructure — a combination of device and interface metrics such as throughput, drops, and discards, as well as metadata like names and descriptions. Syslogs, traps, and other data were also collected, warehoused, and leveraged for alerting.
Over time, the volume of alerts steadily increased, resulting in thousands being delivered to their team. At the same time, the team reported a failure in receiving certain alerts from their legacy, siloed monitoring tools, such as SevOne.
Despite the tools in place, the team struggled to correlate the different signals emitted by the network. These challenges ultimately made it difficult to detect issues, slowing down triage activities.
The customer was also interested in identifying behavior patterns, improving root cause analysis, and investigating anomalous traffic and session behaviors across the Palo Alto firewalls used across their network.
Customer Objectives
- Address scale and frequency requirements to improve overall observability capabilities. For some metrics, the team needed to collect the telemetry every 30s. For less dynamic data, a lower frequency of collection would suffice.
- Combine and correlate the data from different sources such as SNMP, syslogs, and firewall-related telemetry
- Consolidate alerts, helping to combat alert fatigue and improve MTTD.
- Surface insights about concurrent sessions, duration, and traffic anomalies for their Palo Alto firewalls.
The Selector Analytics Solution
Selector’s Kubernetes-based poller addresses the customer’s requirements for the scalable collection of SNMP telemetry. The poller supports the concept of device profiles, enabling users to define which SNMP object identifiers to collect, along with the collection frequency or cadence.
The collection workload is distributed across the deployed pollers and dynamically adjusts as the number of polled devices increases and decreases over time. Additional pollers are automatically provisioned as needed, and the collection workload is then rebalanced. Furthermore, should a poller fail or otherwise become inaccessible, the collection workload will automatically shift to the other pollers comprising the collection service.
Selector also provides correlation across the various metrics, logs, and events collected from the customer’s network. Temporal and contextual analysis groups related anomalies together, consolidating them into an overarching incident. The consolidation dramatically reduces the number of alerts sent to the operations team, helping to combat alert fatigue and reduce MTTD. With the broader context of an incident delivered to the customer in an easy-to-understand format, alerts also become more actionable.
Finally, Selector identifies patterns in the logs and metrics, effectively revealing anomalies in network traffic.
Interface Insights
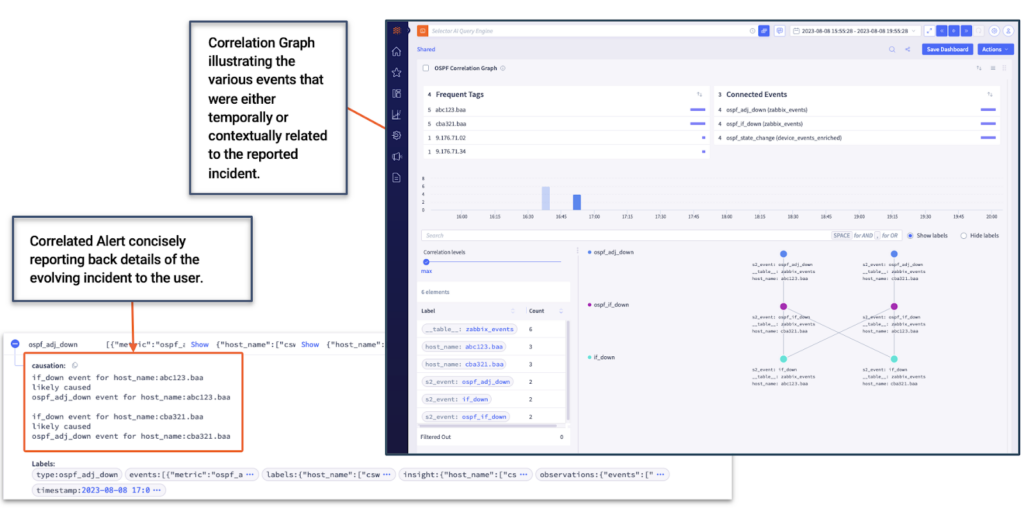
The solution delivered by Selector demonstrates the platform’s ability to combine and correlate data from different sources at scale. The platform analyzes the SNMP metrics, syslogs, alerts, and traps from various devices, creating a correlation graph that illustrates the events related to the reported incident.
For example, an interface down (IF_DOWN) event on Device A may lead to LDP_DOWN, BGP neighbor reset, or OSPF_ADJACENCY_DOWN on all the connected devices. Legacy monitoring and observability platforms would generate excessive alerts for these failures despite their connection to a single root cause. With Selector, event correlation provides consolidated, contextualized views of incidents, suggesting root cause and eliminating the need to sift through thousands of alerts.
The following image depicts the correlation dashboard for this particular scenario.

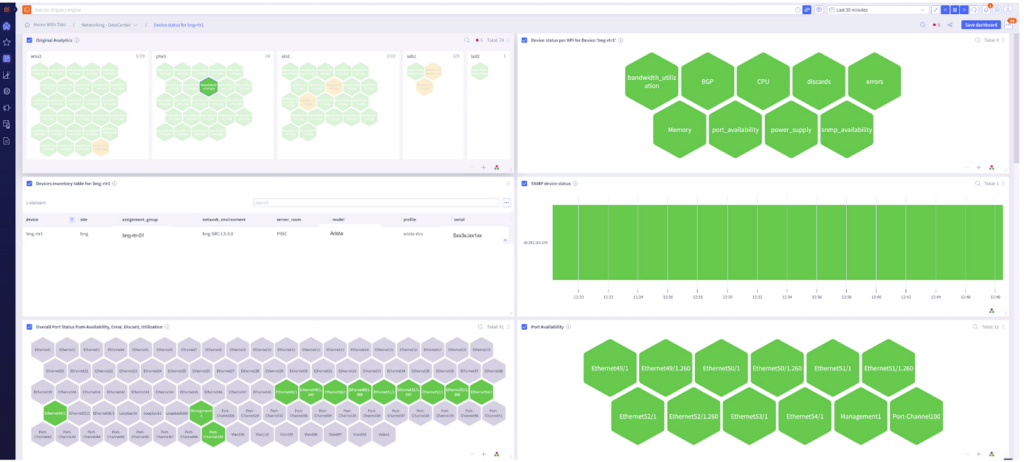
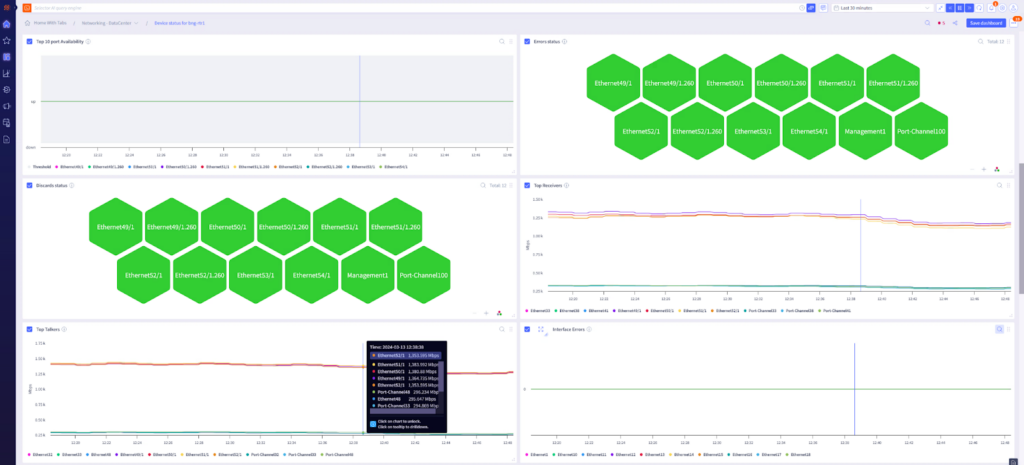
Dashboards provide a consolidated view of all the KPIs for a given network device. They reveal device KPIs such as CPU, interface status, discards, errors, memory, and Border Gateway Protocol (BGP) status.

The customer can drill down further to get the status of the network’s top talkers, the ethernet port that flapped the most, or the status of BGP peers on a network device.

Firewall Anomaly Detection
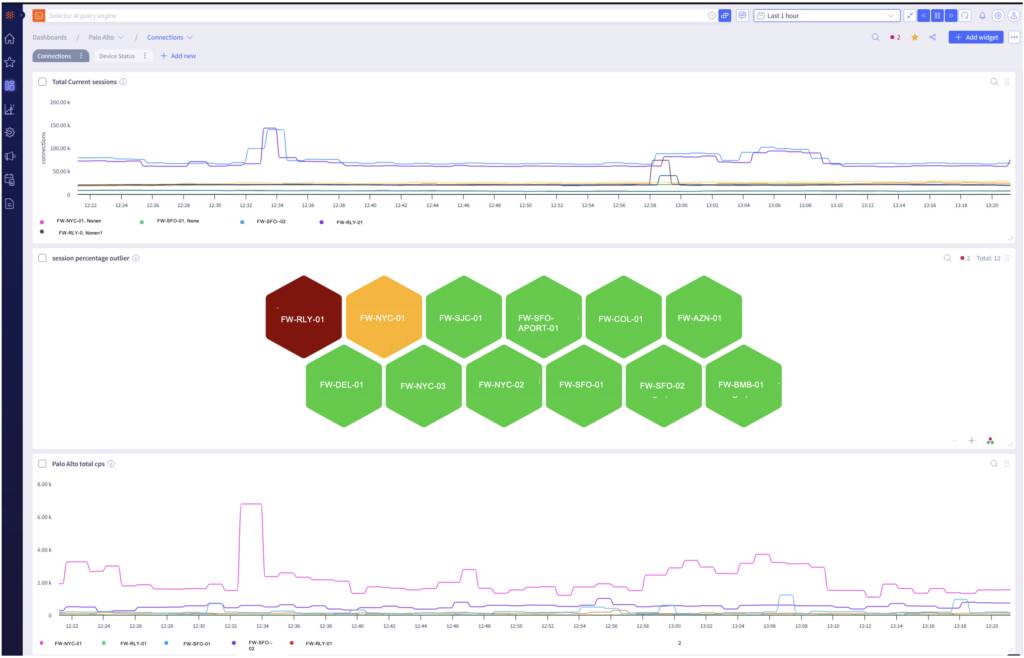
To provide the requested firewall insights for the customer, the Selector platform first ingests metrics and logs generated by Palo Alto. It then analyzes the data, leveraging AI and ML to detect anomalies in session number and duration. Traffic flow is also assessed by the Selector platform, specifically by measuring the input and output byte count. Alerts will be generated if anomalies are detected for any of the above parameters.
For example, the dashboard screenshot below shows an anomaly in the concurrent sessions among a set of firewall devices.

Results
The solution delivered by Selector addressed customer concerns about reliability and robustness by providing poller redundancy and health checks. It also helped the customer reduce MTTD and MTTR by effectively correlating alerts while shrinking the volume of alerts by many folds. The customer appreciates the platform’s consolidated view of network device KPIs as well as its ability to detect anomalies in session behavior based on the log analysis from the firewall.