Selector CUSTOMER Case StudY
Wireless ISP Improves Real-Time Detection of Customer Impacting Network Issues with Selector Analytics
About The Customer
- 5,000+ network elements, including radios, switches and routers
- 2 core markets
Selector Data Inputs
- SNMP Metrics and Traps
- syslog
- Radio telemetry data in a proprietary format
“To deliver top-of-the-line speeds with business-class reliability to our neighborhoods, we depend on Selector’s AIOps engine, which correlates data across logs, events, and metrics, to provide actionable operations insights and real-time performance reports of our network.”
Senior Vice President, Network
The Challenge
This wireless ISP has relied on a combination of open source and low-cost network management tools. While these tools were serving the firms initial network monitoring objectives well, the customer base and network infrastructure was growing rapidly, and the amount of data presented by the tools was exploding. Root cause analysis and issue prioritization was becoming much more challenging.
In particular, the wireless ISP was at an inflection point where they needed to evolve their operational ecosystem. The growth in their business and infrastructure demanded better observability tools that could reduce MTTD and MTTR. As a part of that, they needed a platform ready to scale at the same rate as their business, operations and network infrastructure.
Their environment initially consisted of Influx/Telegraf for log and SNMP trap collection, and PRTG for metrics collection and reporting, along with some proprietary tools related to collection of metrics and alerts from the radios.
Customer Objectives
- Real-time detection of customer-impacting network and radio issues
- Simplification of operational processes with clear and concise information presentation
- Quickly identify root cause of customer-impacting issues
The Selector Analytics Solution
In a transformation journey such as this, a customer will frequently break an implementation into phases, with each phase creating incremental value along the path to full deployment.
Phase 1: Simplifying Operations
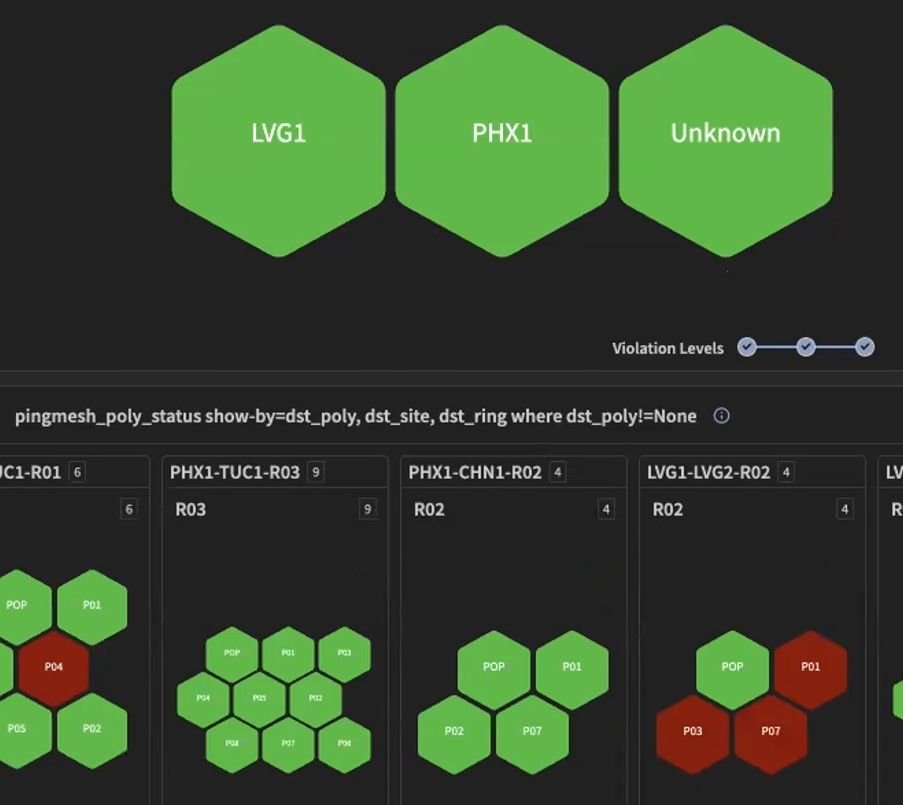
The key goal of the initial phase was to simplify existing operations through the integration of existing data sources with Selector Analytics, so that new contextual insights could be produced. These insights included the introduction of new health indicators that were defined, abstracted, and delivered by Selector Analytics from the existing data. The abstracted health indicators provide a clear and definitive representation of the state of the network, and improve Mean Time to Detection (MTTD) of problems.

Phase 2: Introducing Active Metrics
To further expand upon the MTTD improvement results seen in phase 1 from passive data sets, novel insights into network performance were incorporated through the introduction of a new data element: active performance measurements. With the new data collected through the deployment of Selector Analytics synthetic testing agents, the Selector Analytics engine now has an end-to-end view of performance across the network to correlate with the state of connectivity and network resources. The combination of passive and active assurance provides another significant step towards improving MTTD.
Phase 3: Extracting Data Using Selector’s Machine Learning Capabilities
The next phase of deployment brought alarms and syslog messages into the system. By leveraging Selector’s machine-learning capabilities to detect patterns, cluster data and extract key information into a new data dimension, the correlation engine had more angles to factor into the correlation process. The correlation across all these dimensions helps to narrow the scope of a problem, improving root cause analysis speed, which has a direct impact on another key metric: Mean Time to Repair (MTTR).
Final Phase: End-to-End Real Time Monitoring
The most massive and critical piece of the infrastructure are the radio devices. In this last phase, the data was ingested into Selector Analytics from vendor-proprietary systems so that there was a complete end-to-end view across radio access signal health, metro and core transport elements, which incorporated traps, syslog messages, and telemetry from network and radio devices.

The Results
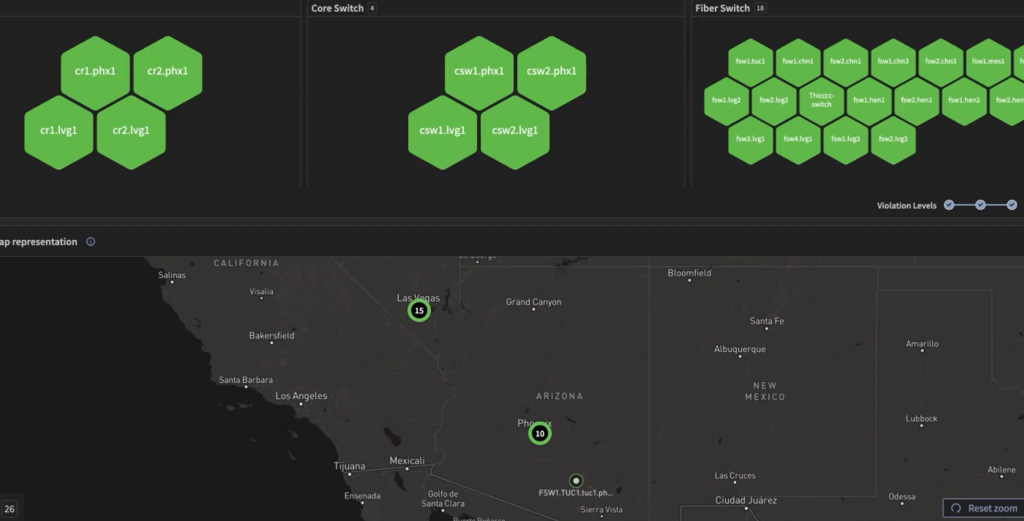
The wireless ISP now has a more simplified operational experience, supported by a scalable cloud-native architecture, with real-time network status and health displayed on a single pane of glass. Operational experience is improved, facilitating better MTTD and MTTR, which has a direct impact on improving customer satisfaction.